
Air Sampling and Air Monitoring
The City of Bristol Virginia: Air Sampling and Air Monitoring
In May 2023, Bristol, Virginia initiated both an air sampling and an air monitoring program at the Bristol Quarry Landfill (“Landfill”). Air sampling involves collecting individual air samples at specific locations in and around the Landfill over a designated period of time. The collected samples are then analyzed by an independent laboratory. Air monitoring utilizes instruments to take real time measurements on a continuous basis of the ambient air conditions at specific locations around the Landfill. These activities are conducted under procedures created by, and under the supervision of, Stantec Consulting Services Inc. (“Stantec”). Stantec is an independent, third-party consultant with offices throughout the United States including Nashville, Tennessee and Columbus, Ohio. Stantec has decades of experience in environmental public health, toxicology, and human and ecological risk assessment.
Why This and Why Now?
Two prior external reviews of air quality – one commenced by the United States Environmental Protection Agency (“EPA”) and another initiated by Bristol, Tennessee – found that no additional action was necessary. Each also indicated that some compounds in the air in and around the greater Bristol community could be from sources other than the landfill.
Bristol, Virginia commenced air monitoring and air sampling to be responsive to citizen requests and feedback, as a condition in the Final Consent Order that settles the federal court case with Bristol Tennessee, and to provide transparency as remediation efforts continue at the quarry landfill under a consent decree approved by the Virginia Attorney General’s Office and the Virginia Department of Environmental Quality. Bristol, Virginia’s efforts additionally will provide data specific as to what gases are in ambient air around the landfill, in gas samples coming from the landfill, and will help to identify specific compounds that have the potential to cause malodors.
Air Sampling – Methodology and Work Completed
In early May 2023, Stantec conducted a synoptic sampling event. “Synoptic sampling” is the collection of samples from several locations over the same 24-hour period. The collected samples provide a representative view of the conditions in that area. This type of sampling is often referred to as a “snapshot.”
First, Stantec obtained gas samples at 3 locations within the Landfill itself. Personnel collected gas samples (for about 30 minutes for each sample) by directly connecting the sample canisters to wellheads in the Sidewall Odor Mitigations System (“SOMS”). The synoptic sampling event provided a “snapshot” of undiluted gas taken from the lower and upper gas extraction wellheads that are a part of the newly installed SOMS. By collecting undiluted gas, Stantec’s goal was to determine the composition of the gas before concentrations were decreased by ambient air.
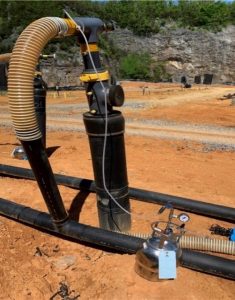
Sampling concentrated Landfill gas from collection system
Second, Stantec collected ambient air samples at 7 locations around the Landfill during a 24-hour time-period. These 7 locations surround the Landfill: One location was north of the quarry and upwind from the Landfill; two locations were on the rim of the Landfill (north and west); one location was ¼ mile west of the Landfill in the parking lot of the Scale House; and three locations were south and downwind of the Landfill between it and the Virginia/Tennessee border. By collecting ambient air samples in these locations, Stantec’s goal was to determine the composition of the ambient air surrounding the Landfill before it left Landfill property.
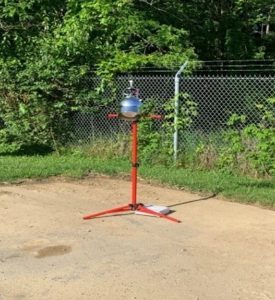
24-hour ambient air sampling – parking lot west of Landfill scale-house, ¼ mile west of the Landfill rim
Stantec utilized Summa® canisters to collect the 10 samples taken. Stantec then sent the cannisters to an independent laboratory (ALS Environmental Global Labs “ALS”) to analyze the collected air in each of the 10 canisters for a long list of individual volatile organic compounds (“VOCs”) and reduced sulfur compounds including hydrogen sulfide. ALS tested each of the collected samples for fixed gases using the EPA Method 3C: testing for hydrogen, nitrogen, carbon monoxide, carbon dioxide, and methane; for VOCs using the EPA Method TO-15 for targeted VOC analytes which includes benzene and other related compounds; and for reduced sulfur compounds using the ASTM Method D 5504-20 for twenty distinct sulfur compounds including hydrogen sulfide, mercaptans, thiophenes, and dimethyl sulfide. Stantec chose these testing methods as they are the industry standards and are EPA approved procedures for measuring the presence and concentrations of these substances.
Air Sampling – Results
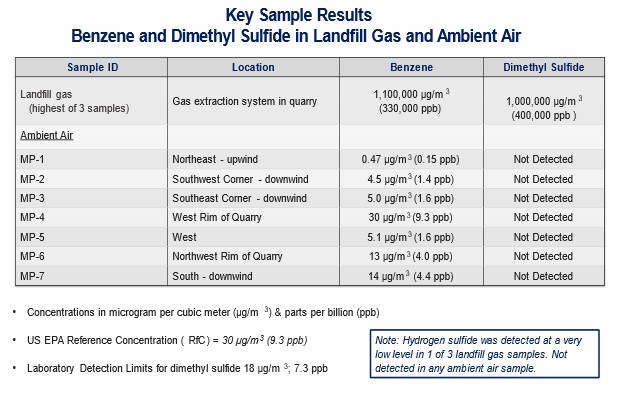
The May synoptic air sampling event (See Table “Key Sample Results”) provided insight into the composition of undiluted Landfill gas taken from the SOMS and the ambient air around the Landfill. The unabridged ALS report for the May synoptic sampling event can be reviewed in full here. Key takeaways include:
Sulfur Compounds in the Dimethyl Sulfide Family Likely Cause Smell
The results of the May synoptic sampling event indicate that dimethyl sulfide and this family of related sulfur compounds are the major cause of odors coming from the Landfill. While results showed dimethyl sulfide in the Landfill gas, they also demonstrated that the levels of dimethyl sulfide in ambient air were less than laboratory detection limits: results showing “not detected” for dimethyl sulfide. Hydrogen sulfide was detected at a very low level – 13 ppb – in only one of the three samples taken from the SOMS system and not detected in any of the samples of ambient air. Additionally, other reduced sulfur compounds were not detected in ambient air, however, people can smell reduced sulfur compounds at levels lower than the laboratory can measure. Dimethyl sulfide and related reduced sulfur compounds are produced naturally from rotting vegetation and other decomposing organic matter. Although dimethyl sulfide is used in some industrial processes, there are no known commercial sources in Bristol. Finally, the EPA and the Agency for Toxic Substances and Disease Registry (“ATSDR) has not set any health-based benchmarks for dimethyl sulfide.
Benzene is Below EPA Reference Level
The amount of benzene detected in ambient air is low and is not unique to Landfill gas. The results of the synoptic sampling event demonstrate that the levels of benzene in ambient air decrease with increasing distance from the Landfill. These results demonstrate that benzene beyond the Landfill boundaries must be interpreted in context with other possible nearby sources of benzene (i.e. gasoline powered motors in automobiles, trucks, and lawn mowers; and retail gasoline stations).
The City of Bristol, VA compared the levels of benzene detected in ambient air around the Landfill to the health-based benchmark set by the EPA referred to as the Reference Concentration (“RfC”). EPA defines the RfC as “an estimate … of a continuous inhalation exposure to the human population (including sensitive subgroups) that is likely to be without an appreciable risk of deleterious effects (non-cancer) during a lifetime”1. RfCs are widely used across EPA programs to develop screening levels and in risk assessment. The current RfC for benzene is 30 µg/m3 (or 9.3 ppb).
The Agency for Toxic Substances and Disease Registry (ATSDR) also develops Minimal Risk Levels (“MRLs”) for use as screening levels. According to ATSDR “An MRL is an estimate of the daily human exposure to a hazardous substance that is likely to be without appreciable risk of adverse non-cancer health effects over a specified duration of exposure.”2 ATSDR has published benzene MRLs for acute exposure from 1 – 14 days (9 ppb); intermediate exposure from 15 – 364 days (6 ppb); and chronic exposure 365 days or longer (3 ppb).
EPA and ATSDR used somewhat different methods to derive the RfC and MRLs for benzene – so the values are similar but not identical. Both the RfC and MRLs are set well below exposure levels where health effects have been reported. Thus concentrations of benzene in ambient air higher than the benchmarks do not necessarily mean that adverse health effects are occurring or will occur, but do suggest additional evaluation may be appropriate.
The detected levels of benzene in the May synoptic sampling events are less than the EPA RfC at each of the 5 locations beyond the rim of Landfill demonstrating that beyond the rim of the Landfill the amount of benzene was below the health-based benchmark when the samples were collected.
1 EPA Terminology Services Vocabulary Catalog
2 ATSDR Minimum Risk Levels for Hazardous Substances
Air Sampling – Path Forward
Stantec conducted the second synoptic event in August 2023, the results of which will be released to the public once they have been analyzed. The third synoptic sampling event, following the same methodology and procedures, is planned for the second quarter of 2024. The results from these next two air sampling events will be compared and contrasted to the May 2023 sampling event.
Air Monitoring – Methodology and Work Completed
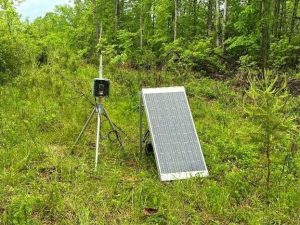
Starting May 15, 2023, the City of Bristol VA initiated continuous monitoring of the ambient air around the Landfill. Field Data Solutions (FDS) under the direction of Stantec installed four MultiRAE PRO® continuous air monitoring stations. The four stations surround the Landfill: Station 1 is northeast of the Landfill and upwind; Station 2 is in the southwest corner of the facility property and downwind from the Landfill; Station 3 is in the southeast corner and downwind from the Landfill (Stations 2 and 3 are also between the Landfill and the Virginia/Tennessee border); and Station 4 is on the west rim of quarry. In addition to the MultiRAE PRO® units, FDS installed two meteorological stations (Met Stations) to record wind direction, wind speed, temperature, relative humidity, and barometric pressure. Met Station 3 is co-located with monitoring Station 3 to the southeast of the quarry and Met Station 2 is located at the landfill scale-house west of the quarry.
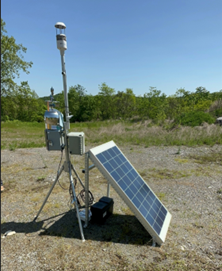
MultiRAE PRO® monitor (Station 3) with weather station
MultiRAE PRO® monitor (Station 2)
Each of the four MultiRAE PRO® units are equipped with individual chemical sensors that measure total volatile organic compounds (“TVOCs”) in parts per billion and hydrogen sulfide in parts per million. Station 4 (located on the quarry rim) also has a sensor specifically for ammonia, measuring in parts per million. The calibration of the individual sensors is verified on a weekly basis. In determining what constituents to measure using the MultiRAE PRO® units, the City consulted with experts, considered the data from the air sampling, and factored into its decision discussions with officials representing the City of Bristol TN and queries from the Bristol community.
Recording of Air Monitoring Data
The MultiRAE PRO® units operate on a telemetry system (wireless transmission of the recorded data) with automatic measurements recorded every five seconds. The sensors operate continuously and relay the results to FDS. With each sensor taking a reading every 5 seconds, there are 12 readings per minute for each sensor, generating 720 unique data points per hour per sensor. FDS uses the real-time 5 second readings to calculate 1-minute average concentrations. The 1-minute averages become individual data points that are then used to determine the minimum, maximum, and average concentrations within a 15-minute interval. In other words, the 15-minute average is based on the 15 1-minute averages within the interval. And then the peak value is the highest 1-minute average recorded during that 15-minute interval. It is these 15-minute averages that are used to generate the graphs and tables for the data collected by the air monitoring. Fifteen-minute intervals are consistent with EPA’s definition of continuous monitoring as 1 reading every 15 minutes.
Presentation of Air Monitoring Data
The weekly FDS Perimeter Air Monitoring Report reports consist of the following four graphs. The weekly periods begin at midnight, 0:00, on Monday and conclude at 23:59 on the following Sunday. To better visualize the hundreds of thousands of data points at each station, data is presented in 15-minute time intervals throughout every 24-hour period. For each graph, the horizontal axis presents the time for each day.
- Graph Average TVOCs: for the one-week period. The TVOC is presented in parts per billion (ppb) on the vertical axis. The graph presents the average over the 15-minute time intervals in the week.
- Graph Average H2S and NH3 (Station 4): for the one-week period. The hydrogen sulfide (H2S) and ammonia (NH3) (only Station 4 has an ammonia sensor) is presented in parts per million (ppm) on the vertical axis. The graph presents the average over the 15-minute time intervals in the week.
- Graph Peak TVOCs: for the one-week period. The peak TVOC is presented in ppb on the vertical axis. The graph presents the peak reading over the 15-minute time intervals in the week.
- Graph Peak H2S and NH3 (Station 4): for the one-week period. The H2S and NH3 (Station 4) is presented in ppm on the vertical axis. The graph presents the peak reading over the 15-minute time intervals in the week.
In addition to the weekly graphs, FDS provides daily summary reports of the readings from each sensor at each of the four Stations. The summaries are calculated using the data from the 96 15-minute time intervals within each 24-hour period. The daily reports include the same graphs as the weekly reports, only presented for the applicable 24-hour period and the following supporting tables:
- Daily Statistics, on a per station basis. The data presented includes, for each parameter, the minimum, maximum, and average concentration data, and peak concentration data for the 24-hour period.
- Time Interval data on a per station basis. The data presented includes, for each parameter, the average concentration data, and peak concentration data, at 15-minute intervals over the 24-hour period.
Finally, FDS provides meteorological data from the two weather stations at the Landfill. The meteorological data consists of climate conditions – wind direction, wind speed, temperature, relative humidity, and barometric pressure recorded by the two Bristol Met Stations.
- Meteorological Daily Statistics. The data presented includes, for each parameter, the minimum, maximum, and average measured data for the 24-hour period.
- Meteorological Time Interval. The data presented includes, for each parameter, the average measured value at 15-minute intervals over the 24-hour period.
What the Perimeter Air Monitoring Reports tell us so far: May & June 2023
Total Volatile Organic Compounds: TVOC is a “non-specific” measure of the level of organic (carbon-containing) chemicals in the air but does not identify the individual volatile organic compounds. In addition to chemicals such as benzene, acetone, alcohols, ethers, and related compounds, TVOCs may also reflect contributions from sources other than the landfill (e.g., motor vehicles, construction equipment, lawnmowers) and volatile compounds released from vegetation. Some volatile organic sulfur compounds such as dimethyl sulfide and mercaptans may also be captured by the TVOC sensors. Hydrogen sulfide is not detected by the TVOC sensor. There are a few general comments that can be made about the TVOCs data so far:
- The TVOCs graphs demonstrate that the levels of TVOCs are highly variable by location, time of day, and day of the week.
- We have observed that each station has a similar daily pattern unique to it.
- Station 1 (northeast and upwind from the quarry) records the lowest levels on most days.
- Concentrations of TVOCs at Station 4 on the quarry rim tended to be higher than concentrations at Stations 2 and 3. However in July, concentrations of TVOCs at Stations 2 or 3 on some days have been higher than concentrations at Station 4.
- The patterns of TVOC may be influenced by daily climate conditions or possibly activities at the quarry, for example, construction projects such as progress installing the SOMS and construction on the southern part of the quarry closer to Stations 2 and 3.
Hydrogen Sulfide: Hydrogen sulfide is a common constituent of landfill gas, but there are other sources of hydrogen sulfide in the environment such as sewage, sewers, indoor plumbing (e.g., dry traps and drains), decaying organic matter, and manure. The MultiRAE PRO® sensor responds to hydrogen sulfide concentrations starting at 0.1 ppm and records concentrations in increments of 0.1 ppm. Because hydrogen sulfide can be of greater concern than other reduced sulfur compounds, the sensor is highly specific to this compound. The sensor can cross-react with a limited number of other sulfur compounds but only if those compounds are present at concentrations of 5 ppm or higher.
The MultiRAE PRO® units rarely detected hydrogen sulfide at any of the four stations. Because the MultiRAE PRO® sensor is very specific to hydrogen sulfide, it is unlikely that the sensors would fail to identify the gas if it was present at 0.1 ppm or higher.
Ammonia: Ammonia can be a constituent of landfill gas, but it has many other environmental sources such as decomposing organic matter, animal, and human waste (e.g., urine-soaked baby diapers), and agricultural fertilizers. The MultiRAE PRO® sensor can detect ammonia starting at 1 ppm. The ammonia sensor does not cross-react with other gases including hydrogen sulfide.
Only one of the MultiRAE PRO® units (located at Station 4) was equipped with an ammonia sensor. Ammonia was rarely detected.
Air Monitoring – Path Forward
In late September, the City of Bristol will replace the 4 MultiRAE® PRO continuous air monitoring stations with custom Scentroid® stations equipped with specialty sensors for TVOCs and additional individual indicator compounds identified through the synoptic sampling event. These specialty sensors will monitor for TVOCs, benzene, hydrogen sulfide, dimethyl sulfide, and ammonia. These sensors will have the capability to measure the compounds at parts per billion levels. Per the terms of the proposed Final Order pending before the United States District Court for the Western District of Virginia, Bristol, Virginia anticipates continuing this monitoring until a cover (geomembrane) is installed over the landfill.
More information about the air monitoring process.
Air Sampling Reports
May 23, 2023
August 31, 2023
September 11, 2023
May 30, 2024
November 4, 2024
June 10, 2025
Location Map #1
Location Map #2
Perimeter Air Monitoring Weekly Reports
February 2-8, 2026
January 26-February 1, 2026
January 19-25, 2026
January 12-18, 2026
January 4-11, 2026
December 29, 2025-January 4, 2026